When it comes to the topic of climate change and the realities that we face, there's no better place to start than with temperature. Over the past century, the pace of industrialization has increased, as developing countries around the world rush to catch up to their more developed and affluent peers.
From the data it is clear to see that there is a pronounced change in the global average temperatures. In some scenarios, temperatures have increased by over 2 degrees celsius, a change that would otherwise have taken thousands if not millions of years if left to natural processes.
With the devastation from Hurricanes Harvey, Sandy, and Katrina as virtual household names in the United States, it seems only sensible to review hurricanes as part of our investigation.
While hurricanes are a natural part of our climate system, recent research suggests that there has been an increase in intense hurricane activity in the North Atlantic since the 1970s. In the future, there may not necessarily be more hurricanes, but there will likely be more intense hurricanes that carry higher wind speeds and more precipitation as a result of global warming. The impacts of this trend are likely to be exacerbated by sea level rise and a growing population along coastlines.
Scientists are continuing to refine our understanding of how global warming affects hurricane activity. Cutting edge research is beginning to be able to attribute individual hurricanes to global warming. For example, new research estimates that as the Earth has warmed, the probability of a storm with precipitation levels like Hurricane Harvey was higher in Texas in 2017 than it was at the end of the twentieth century. Because of climate change, such a storm evolved from a once in every 100 years event to a once in every 16 years event over this time period.
If we look at data from NOAA, two things seem quite clear:
A tropical depression forms when a low pressure area is accompanied by thunderstorms that produce a circular wind flow with maximum sustained winds below 39 mph. An upgrade to a tropical storm occurs when cyclonic circulation becomes more organized and maximum sustained winds gust between 39 mph and 73 mph.
Beyond that, storms are categorized by their sustained wind speed.
Storm Type | Wind Speed (Knots) |
---|---|
Tropical Depression | Less than 29 |
Tropical Storm | 30-55 |
Category 1 Hurricane | 56-72 |
Category 2 Hurricane | 73-83 |
Category 3 Major Hurricane | 84-98 |
Category 4 Major Hurricane | 99-119 |
Category 5 Major Hurricane | Greater than 120 |
The National Hurricane Center (NHC) conducts a post-storm analysis of each tropical cyclone in the Atlantic basin...and the North Pacific Ocean to determine the official assessment of the cyclone's history. This [dataset] makes use of all available observations, including those that may not have been available in real time.
In addition, NHC conducts ongoing reviews of any retrospective tropical cyclone analyses brought to its attention and on a regular basis updates the historical record to reflect changes introduced. Content The NHC publishes the tropical cyclone historical database in a format known as HURDAT, short for HURricane DATabase... [which] contain six-hourly information on the location, maximum winds, central pressure, and (starting in 2004) size of all known tropical cyclones and subtropical cyclones.
"A blanket of warm air covered the city yesterday, trapping pollutants and sending the air-pollution index close to the danger mark. Officials warned persons with heart, lung or respiratory ailments to stay indoors.
From 6 A.M. to 10 A.M., the amount of sulfur dioxide, carbon monoxide and dust-carrying haze was so high that [they were] on the verge of calling the first-alert stage of the city's air pollution system. [...] [T]he pollution count was possibly the highest in the city's history."
"The health warning came from Dr. Aaron D. Chaves, director of the Health Department's Bureau of Tuberculosis. Mindful of the 10-day period of stagnant weather in November, 1963, when 170 to 260 deaths here were attributed to air pollution..."
Starting in 1930, a series of deadly events related to air pollution "forced the world to face the dangers of air pollution and inspired an ongoing movement for cleaner air."
Starting with the Clean Air Act in 1970, the United States passed a series of laws that established government regulations for a variety of pollutants. The Clean Air Act itself was amended a number of times. In addition, the EPA began creating and revising regulations that targeted different sources of pollution.
Since the creation of the EPA and the passing of the Clean Air Act in 1970, we have seen steady declines in unhealthy days and steady increases in good and moderate days in the most highly polluted areas of the United States. Upon reviewing the history of various regulations, it seems reasonable to say that the acceleration of innovation in response to environmental regulations made a positive impact in improving air quality in the United States over the last fifty years.
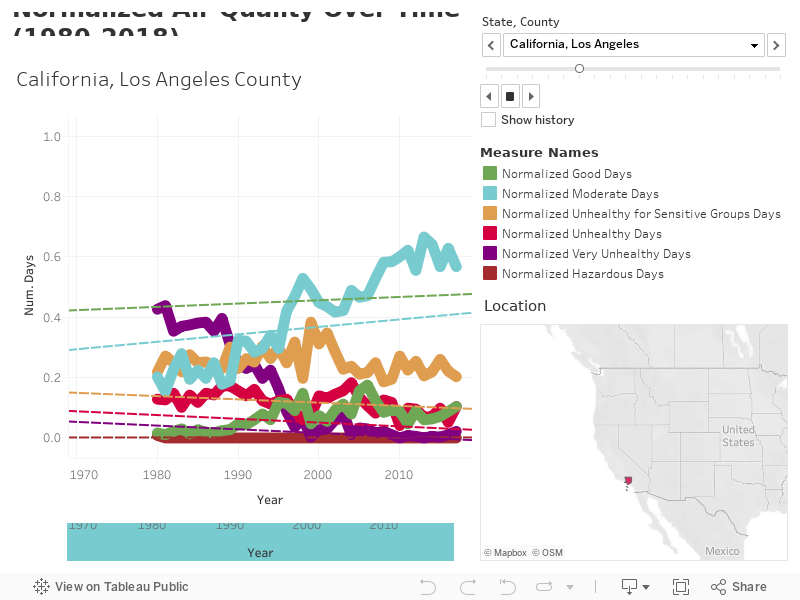
However, while there seems to be a consistent trend of improvement overall, as can be seen in the trend lines displayed on the chart below, it's important to note that the annual measurements in each county are not always consistent with those trends and the possible reasons why this would happen.
In many U.S. communities, AQI values are usually below 100, with higher values occurring just a few times a year. Larger cities typically have more air pollution than smaller cities, so their AQI values may exceed 100 more often. AQI values higher than 200 are infrequent, and AQI values above 300 are extremely rare—they generally occur only during events such as forest fires.
AQI values can vary from one season to another. In winter, carbon monoxide may be high in some areas because cold weather makes it difficult for car emission control systems to operate effectively. Ozone is often higher in warmer months, because heat and sunlight increase ozone formation. Particle pollution can be elevated any time of the year. AQI values also can vary depending on the time of day. Ozone levels often peak in the afternoon to early evening. Carbon monoxide may be a problem during morning or evening rush hours. And particle pollution can be high any time of day, and is often elevated near busy roadways, especially during morning or evening rush hours.
There are also larger events that can affect air quality. For example, decreases in California air quality in 2017 are more than likely due to the incredible scale and power of wildfires that year.
Beyond air quality itself, however, we must also consider the amount of days that were able to be measured. As an example, the number of days with AQI data in New Orleans during 2005 sharply decreased, likely due to Hurricane Katrina. We have attempted to account for variance in the number of days measured by normalizing the data.
Please note that because 2018 is not yet over, the sharp downward turns at the end of the chart are not accurate.
EPA calculates the AQI for five major air pollutants regulated by the Clean Air Act:
For each of these pollutants, EPA has established national air quality standards to protect public health.
The AQI is divied into six categories:
AQI | Numerical Value | Description |
---|---|---|
Good | 0-50 | Air quality is considered satisfactory, and air pollution poses little or no risk. |
Moderate | 51-100 | Air quality is acceptable; however, for some pollutants there may be a moderate health concern for a very small number of people who are unusually sensitive to air pollution. |
Unhealthy for Sensitive Groups | 101-150 | Members of sensitive groups may experience health effects. The general public is not likely to be affected. |
Unhealthy | 151-200 | Everyone may begin to experience health effects; members of sensitive groups may experience more serious health effects. |
Very Unhealthy | 201-300 | Health alert: everyone may experience more serious health effects. |
Hazardous | 301-500 | Health warnings of emergency conditions. The entire population is more likely to be affected. |