Hawaii Weather Data Analysis
This project was done using Numpy, Pandas, MatPlotLib, and Seaborn for analysis, SQLAlchemy serving to connect to a SQLite database I created from CSVs I cleaned, and Flask to generate a mini-API.
The README on Github comprises the Weather Analysis portion of the project. For other aspects, please see the following files:
- data_engineering.ipynb: This file contains the code used to clean the provided CSV datasets.
- database_engineering.ipynb: This file contains the code used to create a SQLite database from the cleaned CSVs.
- app.py: This file contains code for a Flask API based on the datasets I used.
Datasets were provided by Trilogy Education Services (© 2017).
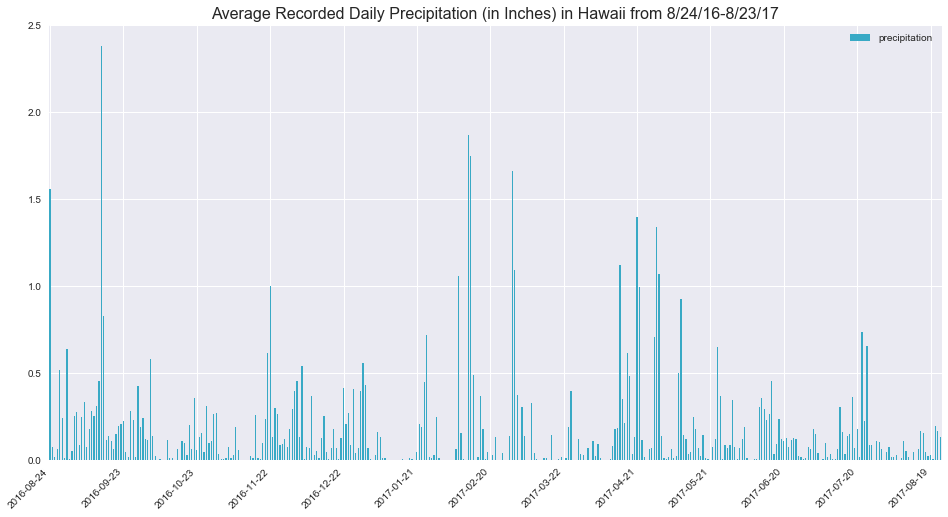
Precipitation Analysis
Between 8/24/2016 and 8/23/2017, Hawaii appears to have recorded observations of some level of precipitation almost every single day. However, it's unclear if precipitation includes only rain or if it includes precipitation like dew.
Across the 2,015 recorded observations, the maximum amount of precipitation recorded was 6.7 inches, but the mean was 0.18 inches.
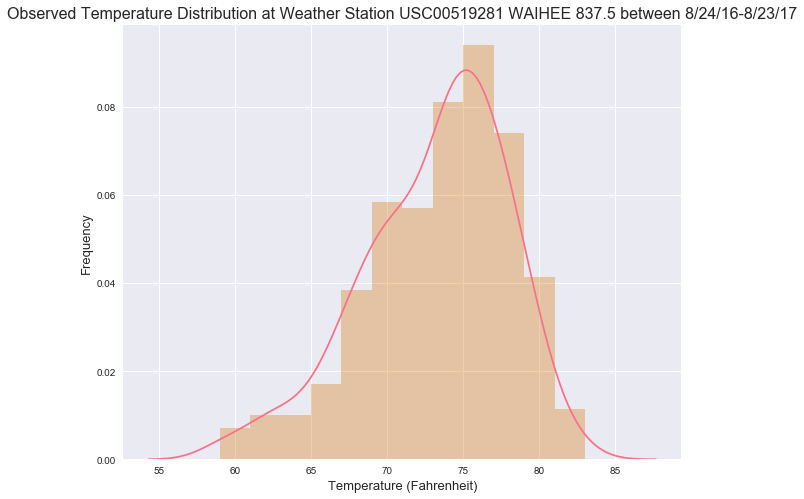
Temperature Analysis
Between 8/24/2016 and 8/23/2017, the majority of recorded temperature observations were between 72.5-77.5°F with the average recorded temperature observation somewhere around 75°F.